


 Blog
Blog Press Releases
 White Papers
 Success Stories
 Videos
 Support KB
 About Us
 Careers
 Contact Us
 Reseller
ZenScoreA powerful analytics and driver engagement software
Drive Fleet Safety and Performance

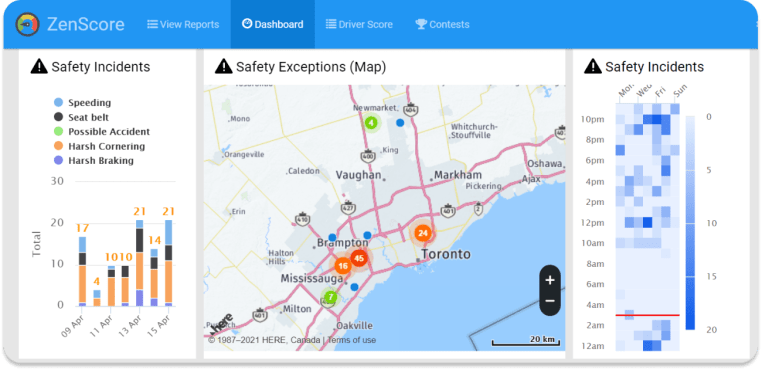
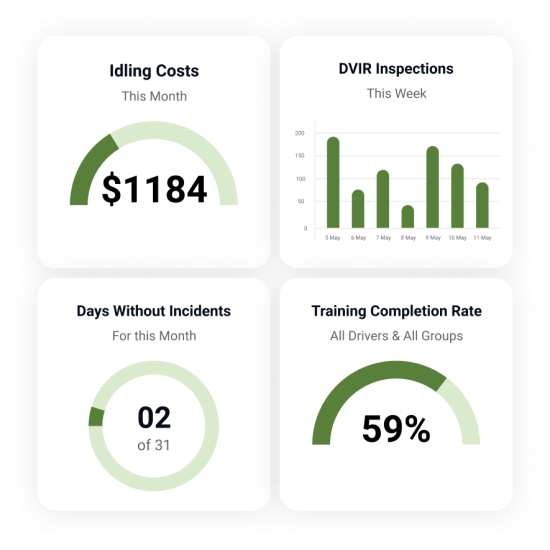
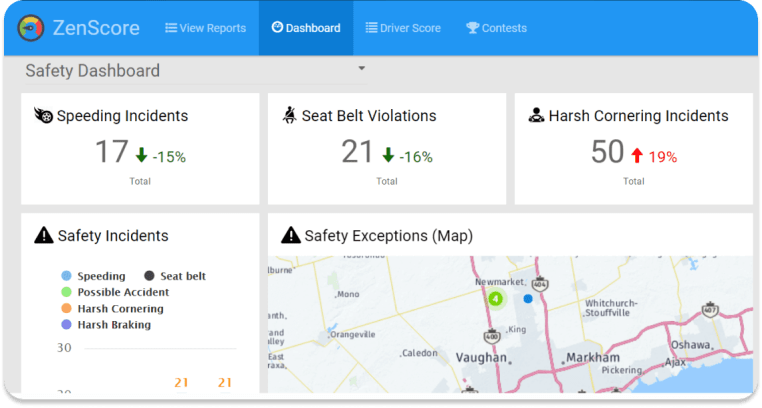
Full Fleet Visibility
The only dashboard that can provide full visibility into a fleet’s KPI progress while displaying the Live Map for real-time tracking.

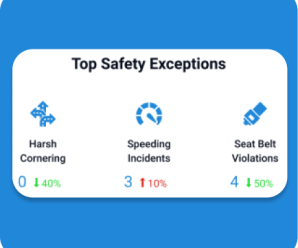
Extensive Safety Data
View important safety metrics that relate to compliance and identify risky driver behavior.

Make More Strategic Decisions
Identify drivers in most need of coaching so you can enhance coaching to help them improve safety and performance behind the wheel.

Complete Visualization
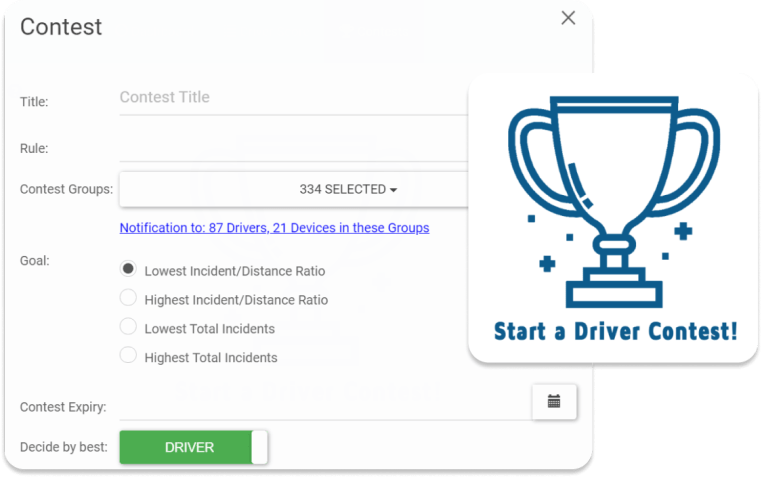
Gamify Safe Driving
Monitor KPI Progress
Customize Your Dashboard
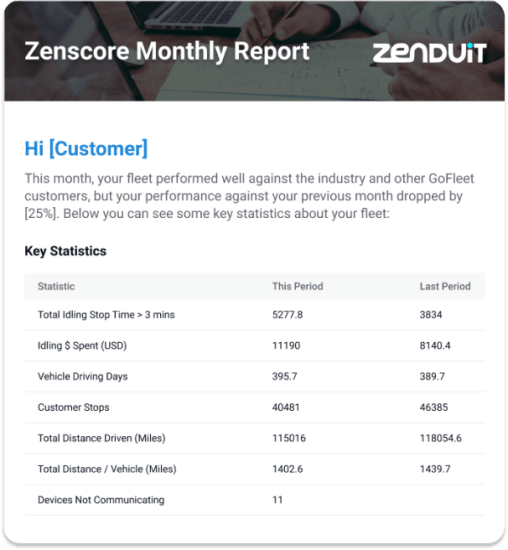
Email Report Function
How it works?
Here’s how you can run safety contests to encourage driver safety compliance.
 01
01
Review your fleet’s safety performance through built-in or custom reports. Use it to see where your fleet can improve.
 02
02
Start a Driver Contest where drivers can score points for good practices related to the metric you want to improve.
 03
03
Analyze the results of the contest. Reward winners and assign training to those who need it.
More Features
Generate KPIs From Extracted Geotab Data
Extract Geotab data and generates key performance indicators to see how your fleet is doing on dashboards.
Consolidated and Convenient Management
Consolidate key Geotab features all in a single view, eliminating the need to toggle between numerous modules to view important information.
Segment Data By Group
Filter data between different vehicle groups and departments to gain greater visibility into the entire fleet.